Infographics
- Whytnee Shattuck
- Oct 9, 2021
- 2 min read

Infographics can be very handy in the classroom and library, especially when a visual representation of information can be more effective than an article. Students often get overwhelmed reading lengthy information relevant to them but can pick up the key points from a simple graphic representation of the same data. Teachers and Librarians alike can take complicated stacks of information and create their own infographic for viewers to glean information. The following sites may help:
This website offers a variety of options for creating your own infographic:
Easel.ly offers a very small variety of pre-made templates with the free account, but compared to other websites, not a high quality or free-friendly amount of options. It's a great starting point for someone who is just branching into the infographic world, but seems the most limited unless the user is willing to sign up for the premium account that allows them to share their creations publicly. Editing the infographics are easy to figure out, and the site allows for users to create their own via blank templates.
This graphic site has a large variety of infographic options and offers the following features:
The free version of this website allows users to create five visuals before needing to upgrade to a paid account. If a users occupation needs multiple infographics, this would be a good choice to pay for simply for the variety, navigability, and amount of options built into the website. Everything within a template is able to be edited, and users can add other features to fit their needs.
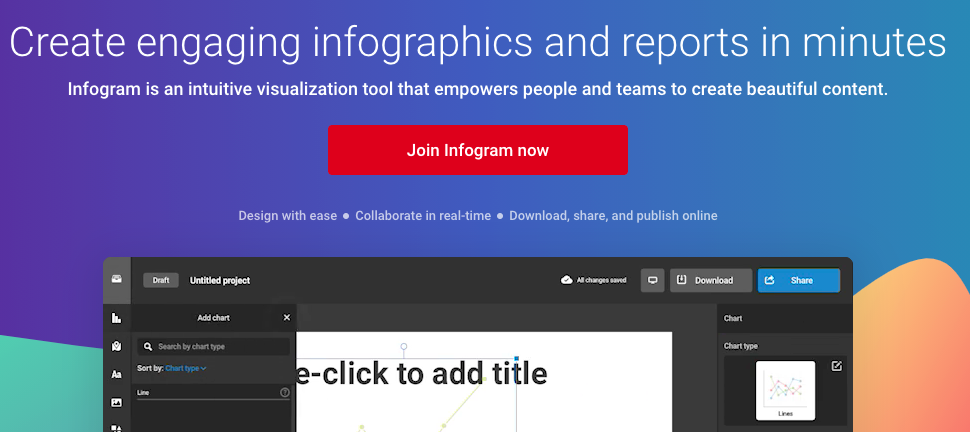
Infogram has some of the best features of a infographic website:
Anything a user creates in the free version of this site legally belongs to Infogram unless the user decides to upgrade to a paid account. The site, however, offers a wonderful and interactive variety of features to add to an infographic. Some really great features include creating collaborative teams to work on graphics together, and the option to add gifs when displaying the graphic publicly. It also makes creating number charts easy by offering drag and drop navigation instead of having to pre-calculate numbers before creating the graphic. Infogram also offers a variety of graphic options, not just infographics layouts. Users can create posters, single charts, maps, instagram posts, facebook posts, reports, and more. It's very similar to using Canva.com, but with infographic options.
My Creation:
For my LSSL 5391 assignment, I chose to use Piktochart. After reading an article on the Pew Research Center's website, here is my infographic concerning teachers juggling multiple jobs to make ends meet: (you can also click the infographic to be redirected to the page)


I like how you stated that students can get the same information from an infographic than with a lengthy paragraph. I love infographics myself. They make statistics and data more interesting and inviting to read.
I've also worked a 2nd job here and there while teaching. It was a must for me to get the extra income!
I held a second job when I started teaching for a couple of years at our local hospital, and then moved from that job to working at our local cinema & drive-in by chance. I worked there for another couple of years until my husband and I started dating. Working at the movies was fun though --- I was able to visit with my students and their families, interact with other kids that were younger, and had a chance to grade on slow nights. I had to have another job. Living at home helped me out financially, and I was able to save money, BUT the fact that I was a college graduate, with a bachelor's degree, and still …